以下是 jQuery圆形饼状数据统计图表js代码 的示例演示效果:
部分效果截图:
HTML代码(index.html):
<!DOCTYPE html PUBLIC "-//W3C//DTD XHTML 1.0 Transitional//EN" "http://www.w3.org/TR/xhtml1/DTD/xhtml1-transitional.dtd">
<html xmlns="http://www.w3.org/1999/xhtml">
<head>
<meta http-equiv="Content-Type" content="text/html; charset=utf-8" />
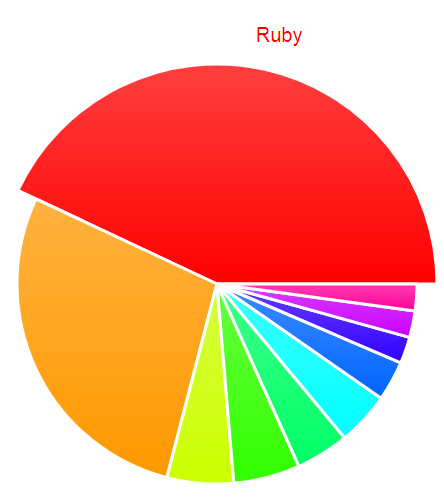
<title>jQuery圆形饼状数据统计图表</title>
<style type="text/css">
*{margin:0;padding:0;list-style-type:none;}
a,img{border:0;}
body{font:12px/180% Arial, Helvetica, sans-serif, "新宋体";}
/* holder */
#holder{margin:-350px 0 0 -350px;width:700px;height:700px;position:absolute;left:50%;top:50%;}
</style>
<script type="text/javascript" src="js/jquery-1.8.3.min.js"></script>
<script type="text/javascript" src="js/raphael-min.js"></script>
<script type="text/javascript" src="js/script.js"></script>
</head>
<body>
<table>
<tbody>
<tr>
<th scope="row">Ruby</th>
<td>40%</td>
</tr>
<tr>
<th scope="row">JavaScript</th>
<td>26%</td>
</tr>
<tr>
<th scope="row">Shell</th>
<td>5%</td>
</tr>
<tr>
<th scope="row">Python</th>
<td>5%</td>
</tr>
<tr>
<th scope="row">PHP</th>
<td>4%</td>
</tr>
<tr>
<th scope="row">C</th>
<td>4%</td>
</tr>
<tr>
<th scope="row">Perl</th>
<td>3%</td>
</tr>
<tr>
<th scope="row">C++</th>
<td>2%</td>
</tr>
<tr>
<th scope="row">Java</th>
<td>2%</td>
</tr>
<tr>
<th scope="row">Objective-C</th>
<td>2%</td>
</tr>
</tbody>
</table>
<div id="holder"></div>
</body>
</html>JS代码(script.js):
Raphael.fn.pieChart = function (cx,cy,r,values,labels,stroke){
	var paper = this,rad = Math.PI / 180,chart = this.set();
	function sector(cx,cy,r,startAngle,endAngle,params){
	var x1 = cx + r * Math.cos(-startAngle * rad),x2 = cx + r * Math.cos(-endAngle * rad),y1 = cy + r * Math.sin(-startAngle * rad),y2 = cy + r * Math.sin(-endAngle * rad);
	return paper.path(["M",cx,cy,"L",x1,y1,"A",r,r,0,+(endAngle - startAngle > 180),0,x2,y2,"z"]).attr(params);
}
var angle = 0,total = 0,start = 0,process = function (j){
	var value = values[j],angleplus = 360 * value / total,popangle = angle + (angleplus / 2),color = Raphael.hsb(start,.75,1),ms = 500,delta = 30,bcolor = Raphael.hsb(start,1,1),p = sector(cx,cy,r,angle,angle + angleplus,{
	fill:"90-" + bcolor + "-" + color,stroke:stroke,"stroke-width":3}
),txt = paper.text(cx + (r + delta + 55) * Math.cos(-popangle * rad),cy + (r + delta + 25) * Math.sin(-popangle * rad),labels[j]).attr({
	fill:bcolor,stroke:"none",opacity:0,"font-size":20}
);
	p.mouseover(function (){
	p.stop().animate({
	transform:"s1.1 1.1 " + cx + " " + cy}
,ms,"elastic");
	txt.stop().animate({
	opacity:1}
,ms,"elastic");
}
).mouseout(function (){
	p.stop().animate({
	transform:""}
,ms,"elastic");
	txt.stop().animate({
	opacity:0}
,ms);
}
);
	angle += angleplus;
	chart.push(p);
	chart.push(txt);
	start += .1;
}
;
	for (var i = 0,ii = values.length;
	i < ii;
	i++){
	total += values[i];
}
for (i = 0;
	i < ii;
	i++){
	process(i);
}
return chart;
}
;
	$(function (){
	var values = [],labels = [];
	$("tr").each(function (){
	values.push(parseInt($("td",this).text(),10));
	labels.push($("th",this).text());
}
);
	$("table").hide();
	Raphael("holder",700,700).pieChart(350,350,200,values,labels,"#fff");
}
);