以下是 jQuery动态统计图形插件js代码 的示例演示效果:
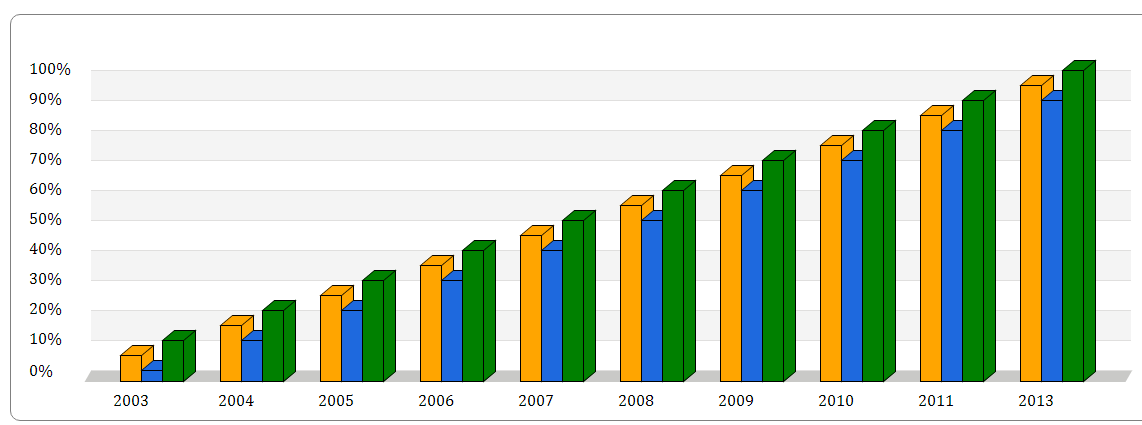
部分效果截图1:
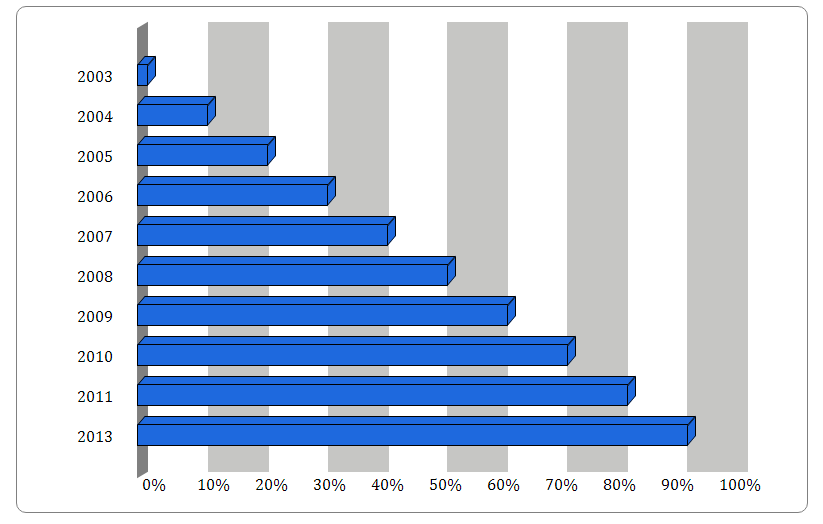
部分效果截图2:
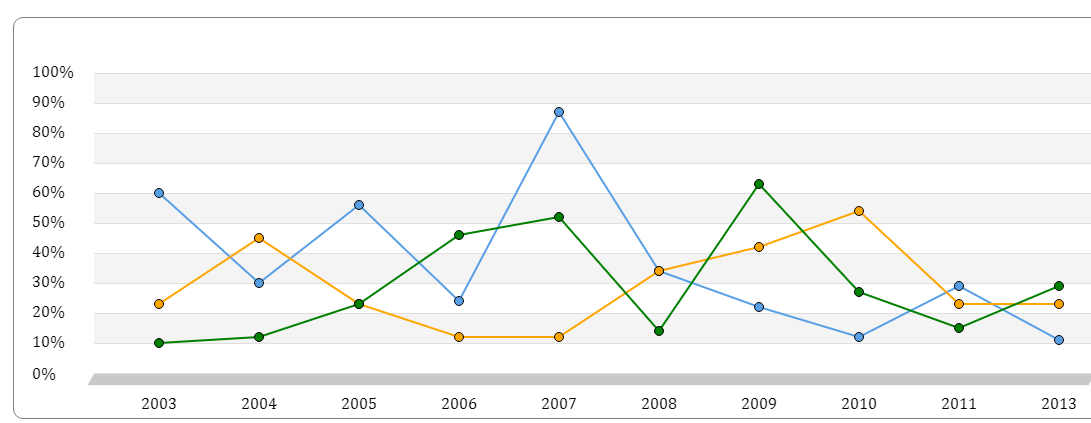
部分效果截图3:
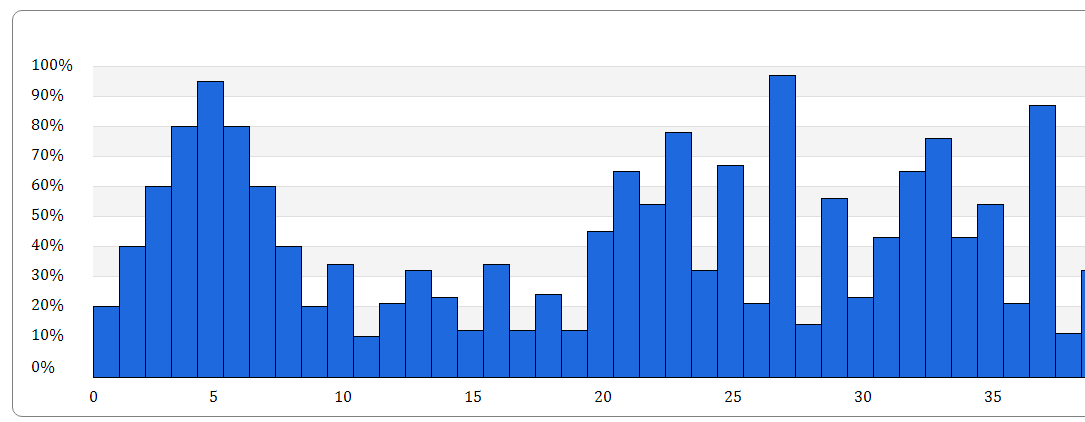
部分效果截图4:
部分效果截图5:
HTML代码(index.html):
<!doctype html>
<html>
<head>
<link rel="stylesheet" href="css/index.css" type="text/css" />
<link rel="stylesheet" href="css/histogram.css" type="text/css" />
<link rel="stylesheet" href="css/horizontal-bar.css" type="text/css" />
<link rel="stylesheet" href="css/linegraph.css" type="text/css" />
<link rel="stylesheet" href="css/pie-graph.css" type="text/css" />
<link rel="stylesheet" href="css/vertical-bar.css" type="text/css" />
<!--[if lte IE 8]><style type="text/css">.horizontalbar-back,.horizontalbar-top,.verticalbar-top,verticalbar-back{display:none;}</style><![endif]-->
<title>jQuery��̬ͳ��ͼ�β��</title>
</head>
<body>
<div id="wrapper">
<div id="top">
<h1>Jquery Graph Plugin</h1>
<ul id="nav">
<li>Vertical-bar</li>
<li>Horizontal-bar</li>
<li>Line Graph</li>
<li>Histogram</li>
<li>Pie graph</li>
</ul>
</div>
<div id="main">
<img src="images/preview.jpg" />
<p>Thanks For taking interest in this product.If you have any questions please feel free to email me at Milanshahnaruto@gmail.com</p>
</div>
<div id="vertical-main">
<p id="verticalbar-label">Population Growth In Years(men-women-children)</p>
<br /><br /><br />
<p>Above graph can be plotted by below simple code using this plugin</p>
<img src="images/1.jpg" />
</div>
<div id="horizontal-main">
<p id="horizontalbar-label">Population Growth In Years</p>
<br /><br /><br />
<p>Above graph can be plotted by below simple code using this plugin</p>
<img src="images/4.jpg" />
</div>
<div id="line-main">
<p class="linegraph-label">Population Growth In Years(Men-Women-Children)</p>
<br /><br /><br />
<p>Above graph can be plotted by below simple code using this plugin</p>
<img src="images/5.jpg" />
</div>
<div id="histogram-main">
<p id="histogram-label">Population Growth In Last 40 Years</p>
<br /><br /><br />
<p>Above graph can be plotted by below simple code using this plugin</p>
<img src="images/histogram-half.jpg" />
</div>
<div id="pie-main">
<br /><br /><br />
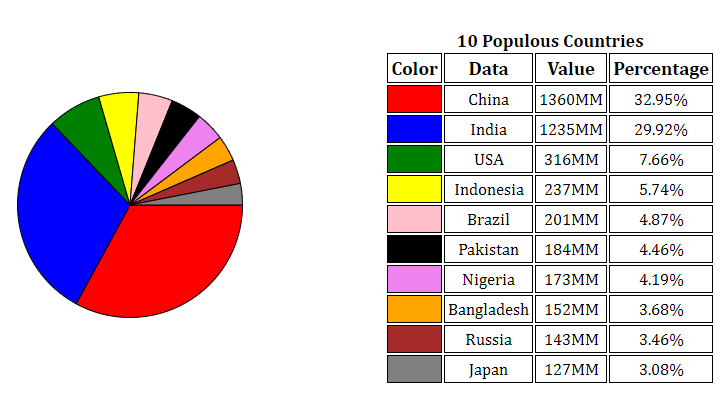
<p>Above graph can be plotted by below simple code using this plugin</p>
<img src="images/71324204/14.jpg" />
</div>
</div>
<script src="js/jquery.1.9.1.min.js"></script>
<script src="js/jquery.histogram.js"></script>
<script src="js/jquery.horizontalchart.js"></script>
<script src="js/jquery.linechart.js"></script>
<script src="js/jquery.piechart.js"></script>
<script src="js/jquery.verticalchart.js"></script>
<script type="text/javascript">
$('#vertical-main').hide();
$('#horizontal-main').hide();
$('#line-main').hide();
$('#histogram-main').hide();
$('#pie-main').hide();
$('#nav li:eq(0)').click(function(){
$('div[id$="main"]').hide();
$('#vertical-main').show();
if($('#verticalbar-chart-wrapper').length == 0){
$('#vertical-main').prepend('<div id="verticalbar-chart-wrapper"></div>');
$('#verticalbar-chart-wrapper').verticalchart({
XData : [2003,2004,2005,2006,2007,2008,2009,2010,2011,2013],
YData : [0,10,20,30,40,50,60,70,80,90,100],
barA : [5,15,25,35,45,55,65,75,85,95],
barB : [0,10,20,30,40,50,60,70,80,90],
barC : [10,20,30,40,50,60,70,80,90,100],
suffix : '%'
});
}
});
$('#nav li:eq(1)').click(function(){
$('div[id$="main"]').hide();
$('#horizontal-main').show();
if($('#horizontalbar-chart-wrapper').length == 0){
$('#horizontal-main').prepend('<div id="horizontalbar-chart-wrapper"></div>');
$('#horizontalbar-chart-wrapper').horizontalchart({
YData : [2003,2004,2005,2006,2007,2008,2009,2010,2011,2013],
XData : [0,10,20,30,40,50,60,70,80,90,100],
bar : [0,10,20,30,40,50,60,70,80,90],
suffix : "%"
});
}
});
$('#nav li:eq(2)').click(function(){
$('div[id$="main"]').hide();
$('#line-main').show();
if($('#linegraph-wrapper').length == 0){
$('#line-main').prepend('<div id="linegraph-wrapper"></div>');
$('#linegraph-wrapper').linechart({
XData : [2003,2004,2005,2006,2007,2008,2009,2010,2011,2013],
YData : [0,10,20,30,40,50,60,70,80,90,100],
line1 : [60,30,56,24,87,34,22,12,29,11],
line2 : [23,45,23,12,12,34,42,54,23,23],
line3 : [10,12,23,46,52,14,63,27,15,29],
suffix : "%"
});
}
});
$('#nav li:eq(3)').click(function(){
$('div[id$="main"]').hide();
$('#histogram-main').show();
if($('#histogram-chart-wrapper').length == 0){
$('#histogram-main').prepend('<div id="histogram-chart-wrapper"></div>');
$('#histogram-chart-wrapper').histogram({
XData : [0,5,10,15,20,25,30,35,40],
YData : [0,10,20,30,40,50,60,70,80,90,100],
bar : [20,40,60,80,95,80,60,40,20,34,10,21,32,23,12,34,12,24,12,45,65,54,78,32,67,21,97,14,56,23,43,65,76,43,54,21,87,11,32,50],
suffix : "%"
});
}
});
$('#nav li:eq(4)').click(function(){
$('div[id$="main"]').hide();
$('#pie-main').show();
if($('#pie-wrapper').length == 0){
$('#pie-main').prepend('<div id="pie-wrapper"></div>');
$('#pie-wrapper').piechart({
piedata : ["China","India","USA","Indonesia","Brazil","Pakistan","Nigeria","Bangladesh","Russia","Japan"],
pievalue : ["1360MM","1235MM","316MM","237MM","201MM","184MM","173MM","152MM","143MM","127MM"],
piecolor : ["red","blue","green","yellow","pink","black","violet","orange","brown","gray"],
label : "10 Populous Countries"
});
}
});
</script>
</body>
</html>
JS代码(jquery.piechart.js):
var _0x2324=["\x70\x69\x65\x63\x68\x61\x72\x74","\x66\x6E","\x62\x6C\x61\x63\x6B","\x43\x61\x70\x74\x69\x6F\x6E","\x34\x35\x30\x70\x78","\x65\x78\x74\x65\x6E\x64","\x6C\x65\x6E\x67\x74\x68","\x70\x69\x65\x76\x61\x6C\x75\x65","\x3C\x63\x61\x6E\x76\x61\x73\x20\x69\x64\x3D\x22\x70\x69\x65\x22\x20\x77\x69\x64\x74\x68\x3D\x22","\x63\x61\x6E\x76\x61\x73\x53\x69\x7A\x65","\x22\x20\x68\x65\x69\x67\x68\x74\x3D\x22","\x22\x3E\x3C\x2F\x63\x61\x6E\x76\x61\x73\x3E","\x70\x72\x65\x70\x65\x6E\x64","\x23\x70\x69\x65\x2D\x77\x72\x61\x70\x70\x65\x72","\x3C\x64\x69\x76\x20\x69\x64\x3D\x22\x70\x69\x65\x2D\x74\x61\x62\x6C\x65\x22\x3E\x3C\x74\x61\x62\x6C\x65\x20\x69\x64\x3D\x22\x70\x69\x65\x2D\x6C\x61\x62\x65\x6C\x22\x3E\x3C\x2F\x74\x61\x62\x6C\x65\x3E\x3C\x2F\x64\x69\x76\x3E","\x61\x70\x70\x65\x6E\x64","\x3C\x63\x61\x70\x74\x69\x6F\x6E\x3E","\x6C\x61\x62\x65\x6C","\x3C\x2F\x63\x61\x70\x74\x69\x6F\x6E\x3E","\x23\x70\x69\x65\x2D\x6C\x61\x62\x65\x6C","\x3C\x74\x72\x3E\x3C\x74\x68\x3E\x43\x6F\x6C\x6F\x72\x3C\x2F\x74\x68\x3E\x3C\x74\x68\x3E\x44\x61\x74\x61\x3C\x2F\x74\x68\x3E\x3C\x74\x68\x3E\x56\x61\x6C\x75\x65\x3C\x2F\x74\x68\x3E\x3C\x74\x68\x3E\x50\x65\x72\x63\x65\x6E\x74\x61\x67\x65\x3C\x2F\x74\x68\x3E\x3C\x2F\x74\x72\x3E","\x23\x70\x69\x65","\x32\x64","\x67\x65\x74\x43\x6F\x6E\x74\x65\x78\x74","\x68\x65\x69\x67\x68\x74","\x70\x69\x65\x72\x61\x64\x69\x75\x73","\x77\x69\x64\x74\x68","\x3C\x74\x72\x3E\x3C\x2F\x74\x72\x3E","\x74\x6F\x46\x69\x78\x65\x64","\x50\x49","\x62\x65\x67\x69\x6E\x50\x61\x74\x68","\x6C\x69\x6E\x65\x57\x69\x64\x74\x68","\x61\x72\x63","\x6C\x69\x6E\x65\x54\x6F","\x63\x6C\x6F\x73\x65\x50\x61\x74\x68","\x73\x74\x72\x6F\x6B\x65\x53\x74\x79\x6C\x65","\x73\x74\x72\x6F\x6B\x65","\x66\x69\x6C\x6C\x53\x74\x79\x6C\x65","\x70\x69\x65\x63\x6F\x6C\x6F\x72","\x3C\x74\x64\x3E\x3C\x2F\x74\x64\x3E","\x65\x71","\x23\x70\x69\x65\x2D\x6C\x61\x62\x65\x6C\x20\x74\x72","\x62\x61\x63\x6B\x67\x72\x6F\x75\x6E\x64\x2D\x63\x6F\x6C\x6F\x72","\x63\x73\x73","\x74\x64","\x63\x68\x69\x6C\x64\x72\x65\x6E","\x23\x70\x69\x65\x2D\x6C\x61\x62\x65\x6C\x20\x74\x72\x20","\x70\x69\x65\x64\x61\x74\x61","\x74\x65\x78\x74","\x25","\x66\x69\x6C\x6C","\x73\x65\x74\x54\x69\x6D\x65\x6F\x75\x74"];
	(function (_0x9c1fx1){
	_0x9c1fx1[_0x2324[1]][_0x2324[0]]=function (_0x9c1fx2){
	var _0x9c1fx3=_0x9c1fx1[_0x2324[5]]({
	piedata:[],pievalue:[],piecolor:[],pieradius:4,stroke:_0x2324[2],lineWidth:1,label:_0x2324[3],canvasSize:_0x2324[4]}
,_0x9c1fx2);
	var _0x9c1fx4=0;
	for(var _0x9c1fx5=0;
	_0x9c1fx5<_0x9c1fx3[_0x2324[7]][_0x2324[6]];
	_0x9c1fx5++){
	_0x9c1fx4+=parseInt(_0x9c1fx3[_0x2324[7]][_0x9c1fx5],10);
}
;
	_0x9c1fx1(_0x2324[13])[_0x2324[12]](_0x2324[8]+_0x9c1fx3[_0x2324[9]]+_0x2324[10]+_0x9c1fx3[_0x2324[9]]+_0x2324[11]);
	_0x9c1fx1(_0x2324[13])[_0x2324[15]](_0x2324[14]);
	_0x9c1fx1(_0x2324[19])[_0x2324[12]](_0x2324[16]+_0x9c1fx3[_0x2324[17]]+_0x2324[18]);
	_0x9c1fx1(_0x2324[19])[_0x2324[15]](_0x2324[20]);
	var _0x9c1fx6=_0x9c1fx1(_0x2324[21])[0];
	var _0x9c1fx7=_0x9c1fx6[_0x2324[23]](_0x2324[22]);
	var _0x9c1fx8=0;
	var _0x9c1fx9=_0x9c1fx6[_0x2324[24]]/_0x9c1fx3[_0x2324[25]];
	var _0x9c1fxa=_0x9c1fx6[_0x2324[26]]/2;
	var _0x9c1fxb=_0x9c1fx6[_0x2324[24]]/2;
	for(var _0x9c1fxc=0;
	_0x9c1fxc<_0x9c1fx3[_0x2324[7]][_0x2324[6]];
	_0x9c1fxc++){
	(function (_0x9c1fxc){
	window[_0x2324[51]](function (){
	_0x9c1fx1(_0x2324[19])[_0x2324[15]](_0x2324[27]);
	var _0x9c1fxd=parseInt(_0x9c1fx3[_0x2324[7]][_0x9c1fxc],10)/_0x9c1fx4;
	var _0x9c1fxe=(_0x9c1fxd*100)[_0x2324[28]](2);
	var _0x9c1fxf=2*Math[_0x2324[29]]*_0x9c1fxd;
	var _0x9c1fx10=_0x9c1fx8+_0x9c1fxf;
	_0x9c1fx7[_0x2324[30]]();
	_0x9c1fx7[_0x2324[31]]=_0x9c1fx3[_0x2324[31]];
	_0x9c1fx7[_0x2324[32]](_0x9c1fxa,_0x9c1fxb,_0x9c1fx9,_0x9c1fx8,_0x9c1fx10,false);
	_0x9c1fx7[_0x2324[33]](_0x9c1fxa,_0x9c1fxb);
	_0x9c1fx7[_0x2324[34]]();
	_0x9c1fx7[_0x2324[35]]=_0x9c1fx3[_0x2324[36]];
	_0x9c1fx7[_0x2324[37]]=_0x9c1fx3[_0x2324[38]][_0x9c1fxc];
	_0x9c1fx1(_0x2324[41])[_0x2324[40]](_0x9c1fxc+1)[_0x2324[12]](_0x2324[39]);
	_0x9c1fx1(_0x2324[46])[_0x2324[40]](_0x9c1fxc+1)[_0x2324[45]](_0x2324[44])[_0x2324[40]](0)[_0x2324[43]](_0x2324[42],_0x9c1fx3[_0x2324[38]][_0x9c1fxc]);
	_0x9c1fx1(_0x2324[41])[_0x2324[40]](_0x9c1fxc+1)[_0x2324[15]](_0x2324[39]);
	_0x9c1fx1(_0x2324[41])[_0x2324[40]](_0x9c1fxc+1)[_0x2324[45]](_0x2324[44])[_0x2324[40]](1)[_0x2324[48]](_0x9c1fx3[_0x2324[47]][_0x9c1fxc]);
	_0x9c1fx1(_0x2324[41])[_0x2324[40]](_0x9c1fxc+1)[_0x2324[15]](_0x2324[39]);
	_0x9c1fx1(_0x2324[41])[_0x2324[40]](_0x9c1fxc+1)[_0x2324[45]](_0x2324[44])[_0x2324[40]](2)[_0x2324[48]](_0x9c1fx3[_0x2324[7]][_0x9c1fxc]);
	_0x9c1fx1(_0x2324[41])[_0x2324[40]](_0x9c1fxc+1)[_0x2324[15]](_0x2324[39]);
	_0x9c1fx1(_0x2324[41])[_0x2324[40]](_0x9c1fxc+1)[_0x2324[45]](_0x2324[44])[_0x2324[40]](3)[_0x2324[48]](_0x9c1fxe+_0x2324[49]);
	_0x9c1fx7[_0x2324[50]]();
	_0x9c1fx7[_0x2324[36]]();
	_0x9c1fx8+=_0x9c1fxf;
}
,_0x9c1fxc*500);
}
(_0x9c1fxc));
}
;
}
;
}
)(jQuery);
CSS代码(index.css):
body{}
h1{text-align:center;font:bold 30px cambria;}
#nav{list-style-type:none;margin:0;padding:0;}
#nav li{display:inline-block;color:white;padding:10px;font:20px cambria;border-right:1px solid white;cursor:pointer;}
#nav{background-color:black;}
#main img{margin-left:350px;margin-top:100px;}
#main p{margin-left:150px;}
#vertical-main,#horizontal-main,#line-main,#histogram-main,#pie-main{margin-left:10px;font:17px cambria;}
p{margin-left:100px;}
img{margin-left:100px;}
#highlight{font:bold 25px arial;}
CSS代码(pie-graph.css):
#pie-wrapper{width:750px;margin:50px 0px 0px 250px;}
#pie{}
#pie-table{width:270px;height:auto;float:right;margin-top:50px;}
#pie-label caption{font-family:Cambria;text-align:center;font-size:18px;font-weight:bold;}
#pie-label{font-family:Cambria;width:100%;}
#pie-label td,#pie-label th{font-size:1em;border:1px solid black;padding:3px;text-align:center;}
#pie-label th{font-size:1.1em;text-align:center;color:black;}