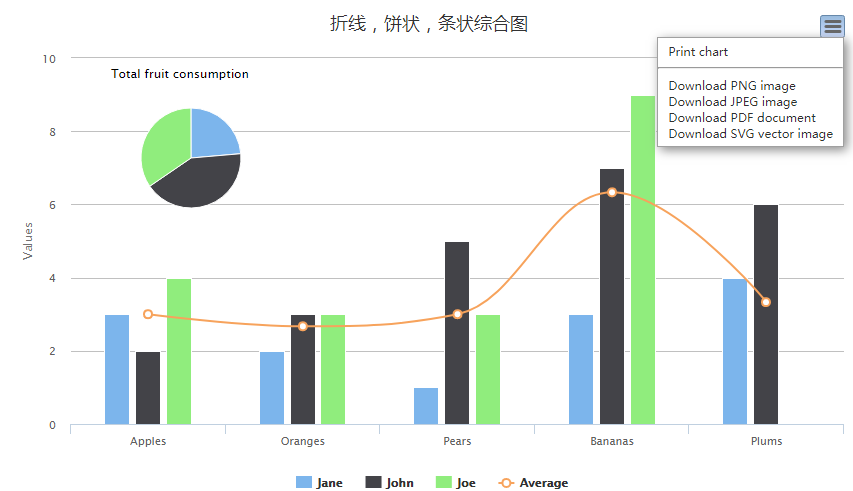
以下是 jQuery混合图表数据统计代码 的示例演示效果:
部分效果截图:
HTML代码(index.html):
<!DOCTYPE html PUBLIC "-//W3C//DTD XHTML 1.0 Transitional//EN" "http://www.w3.org/TR/xhtml1/DTD/xhtml1-transitional.dtd">
<html xmlns="http://www.w3.org/1999/xhtml">
<head>
<meta http-equiv="Content-Type" content="text/html; charset=utf-8" />
<title>jQuery混合图表数据统计代码</title>
<script type="text/javascript" src="js/jquery.js"></script>
<script type="text/javascript" src="js/highcharts.js"></script>
<script type="text/javascript" src="js/exporting.js"></script>
<script type="text/javascript">
	 $(function () {
    $('#container').highcharts({
        chart: {
        },
        title: {
            text: '折线,饼状,条状综合图'
        },
		//x轴
        xAxis: {
            categories: ['Apples', 'Oranges', 'Pears', 'Bananas', 'Plums']
        },
        tooltip: {
            formatter: function() {
                var s;
                if (this.point.name) { // the pie chart
                    s = ''+
                        this.point.name +': '+ this.y +' fruits';
                } else {
                    s = ''+
                        this.x  +': '+ this.y;
                }
                return s;
            }
        },
        labels: {
            items: [{
                html: 'Total fruit consumption',
                style: {
                    left: '40px',
                    top: '8px',
                    color: 'black'
                }
            }]
        },
        series: [{
            type: 'column',
            name: 'Jane',
            data: [3, 2, 1, 3, 4]
        }, {
            type: 'column',
            name: 'John',
            data: [2, 3, 5, 7, 6]
        }, {
            type: 'column',
            name: 'Joe',
            data: [4, 3, 3, 9, 0]
        }, {
            type: 'spline',
            name: 'Average',
            data: [3, 2.67, 3, 6.33, 3.33],
            marker: {
            	lineWidth: 2,
            	lineColor: Highcharts.getOptions().colors[3],
            	fillColor: 'white'
            }
        }, {
            type: 'pie',
            name: 'Total consumption',
            data: [{
                name: 'Jane',
                y: 13,
                color: Highcharts.getOptions().colors[0] // Jane's color
            }, {
                name: 'John',
                y: 23,
                color: Highcharts.getOptions().colors[1] // John's color
            }, {
                name: 'Joe',
                y: 19,
                color: Highcharts.getOptions().colors[2] // Joe's color
            }],
            center: [100, 80],
            size: 100,
            showInLegend: false,
            dataLabels: {
                enabled: false
            }
        }]
    });
});
</script>
</head>
<body>
<div id="container" style="width:850px;height:500px;margin:0 auto"></div>
</body>
</html>
JS代码(exporting.js):
/* Highcharts JS v4.0.3 (2014-07-03) Exporting module (c) 2010-2014 Torstein Honsi License:www.highcharts.com/license*/
(function(f){
var A=f.Chart,t=f.addEvent,B=f.removeEvent,l=f.createElement,o=f.discardElement,v=f.css,k=f.merge,r=f.each,p=f.extend,D=Math.max,j=document,C=window,E=f.isTouchDevice,F=f.Renderer.prototype.symbols,s=f.getOptions(),y;
p(s.lang,{
printChart:"Print chart",downloadPNG:"Download PNG image",downloadJPEG:"Download JPEG image",downloadPDF:"Download PDF document",downloadSVG:"Download SVG vector image",contextButtonTitle:"Chart context menu"}
);
s.navigation={
menuStyle:{
border:"1px solid #A0A0A0",background:"#FFFFFF",padding:"5px 0"}
,menuItemStyle:{
padding:"0 10px",background:"none",color:"#303030",fontSize:E?"14px":"11px"}
,menuItemHoverStyle:{
background:"#4572A5",color:"#FFFFFF"}
,buttonOptions:{
symbolFill:"#E0E0E0",symbolSize:14,symbolStroke:"#666",symbolStrokeWidth:3,symbolX:12.5,symbolY:10.5,align:"right",buttonSpacing:3,height:22,theme:{
fill:"white",stroke:"none"}
,verticalAlign:"top",width:24}
}
;
s.exporting={
type:"image/png",url:"http://export.highcharts.com/",buttons:{
contextButton:{
menuClassName:"highcharts-contextmenu",symbol:"menu",_titleKey:"contextButtonTitle",menuItems:[{
textKey:"printChart",onclick:function(){
this.print()}
}
,{
separator:!0}
,{
textKey:"downloadPNG",onclick:function(){
this.exportChart()}
}
,{
textKey:"downloadJPEG",onclick:function(){
this.exportChart({
type:"image/jpeg"}
)}
}
,{
textKey:"downloadPDF",onclick:function(){
this.exportChart({
type:"application/pdf"}
)}
}
,{
textKey:"downloadSVG",onclick:function(){
this.exportChart({
type:"image/svg+xml"}
)}
}
]}
}
}
;
f.post=function(b,a,d){
var c,b=l("form",k({
method:"post",action:b,enctype:"multipart/form-data"}
,d),{
display:"none"}
,j.body);
for(c in a)l("input",{
type:"hidden",name:c,value:a[c]}
,null,b);
b.submit();
o(b)}
;
p(A.prototype,{
getSVG:function(b){
var a=this,d,c,z,h,g=k(a.options,b);
if(!j.createElementNS)j.createElementNS=function(a,b){
return j.createElement(b)}
;
b=l("div",null,{
position:"absolute",top:"-9999em",width:a.chartWidth+"px",height:a.chartHeight+"px"}
,j.body);
c=a.renderTo.style.width;
h=a.renderTo.style.height;
c=g.exporting.sourceWidth||g.chart.width||/px$/.test(c)&&parseInt(c,10)||600;
h=g.exporting.sourceHeight||g.chart.height||/px$/.test(h)&&parseInt(h,10)||400;
p(g.chart,{
animation:!1,renderTo:b,forExport:!0,width:c,height:h}
);
g.exporting.enabled=!1;
g.series=[];
r(a.series,function(a){
z=k(a.options,{
animation:!1,enableMouseTracking:!1,showCheckbox:!1,visible:a.visible}
);
z.isInternal||g.series.push(z)}
);
d=new f.Chart(g,a.callback);
r(["xAxis","yAxis"],function(b){
r(a[b],function(a,c){
var g=d[b][c],f=a.getExtremes(),h=f.userMin,f=f.userMax;
g&&(h!==void 0||f!==void 0)&&g.setExtremes(h,f,!0,!1)}
)}
);
c=d.container.innerHTML;
g=null;
d.destroy();
o(b);
c=c.replace(/zIndex="[^"]+"/g,"").replace(/isShadow="[^"]+"/g,"").replace(/symbolName="[^"]+"/g,"").replace(/jQuery[0-9]+="[^"]+"/g,"").replace(/url\([^#]+#/g,"url(#").replace(/<svg /,'<svg xmlns:xlink="http://www.w3.org/1999/xlink" ').replace(/ href=/g," xlink:href=").replace(/\n/," ").replace(/<\/svg>.*?$/,"</svg>").replace(/(fill|stroke)="rgba\(([ 0-9]+,[ 0-9]+,[ 0-9]+),([ 0-9\.]+)\)"/g,'$1="rgb($2)" $1-opacity="$3"').replace(/
/g," ").replace(/­
/g,"").replace(/<IMG /g,"<image ").replace(/height=([^" ]+)/g,'height="$1"').replace(/width=([^" ]+)/g,'width="$1"').replace(/hc-svg-href="([^"]+)">/g,'xlink:href="$1"/>').replace(/id=([^" >]+)/g,'id="$1"').replace(/class=([^" >]+)/g,'class="$1"').replace(/ transform /g," ").replace(/:(path|rect)/g,"$1").replace(/style="([^"]+)"/g,function(a){
return a.toLowerCase()}
);
return c=c.replace(/(url\(#highcharts-[0-9]+)"
/g,"$1").replace(/"
/g,"'")}
,exportChart:function(b,a){
var b=b||{
}
,d=this.options.exporting,d=this.getSVG(k({
chart:{
borderRadius:0}
}
,d.chartOptions,a,{
exporting:{
sourceWidth:b.sourceWidth||d.sourceWidth,sourceHeight:b.sourceHeight||d.sourceHeight}
}
)),b=k(this.options.exporting,b);
f.post(b.url,{
filename:b.filename||"chart",type:b.type,width:b.width||0,scale:b.scale||2,svg:d}
,b.formAttributes)}
,print:function(){
var b=this,a=b.container,d=[],c=a.parentNode,f=j.body,h=f.childNodes;
if(!b.isPrinting)b.isPrinting=!0,r(h,function(a,b){
if(a.nodeType===1)d[b]=a.style.display,a.style.display="none"}
),f.appendChild(a),C.focus(),C.print(),setTimeout(function(){
c.appendChild(a);
r(h,function(a,b){
if(a.nodeType===1)a.style.display=d[b]}
);
b.isPrinting=!1}
,1E3)}
,contextMenu:function(b,a,d,c,f,h,g){
var e=this,k=e.options.navigation,q=k.menuItemStyle,m=e.chartWidth,n=e.chartHeight,j="cache-"+b,i=e[j],u=D(f,h),w,x,o,s=function(a){
e.pointer.inClass(a.target,b)||x()}
;
if(!i)e[j]=i=l("div",{
className:b}
,{
position:"absolute",zIndex:1E3,padding:u+"px"}
,e.container),w=l("div",null,p({
MozBoxShadow:"3px 3px 10px #888",WebkitBoxShadow:"3px 3px 10px #888",boxShadow:"3px 3px 10px #888"}
,k.menuStyle),i),x=function(){
v(i,{
display:"none"}
);
g&&g.setState(0);
e.openMenu=!1}
,t(i,"mouseleave",function(){
o=setTimeout(x,500)}
),t(i,"mouseenter",function(){
clearTimeout(o)}
),t(document,"mouseup",s),t(e,"destroy",function(){
B(document,"mouseup",s)}
),r(a,function(a){
if(a){
var b=a.separator?l("hr",null,null,w):l("div",{
onmouseover:function(){
v(this,k.menuItemHoverStyle)}
,onmouseout:function(){
v(this,q)}
,onclick:function(){
x();
a.onclick.apply(e,arguments)}
,innerHTML:a.text||e.options.lang[a.textKey]}
,p({
cursor:"pointer"}
,q),w);
e.exportDivElements.push(b)}
}
),e.exportDivElements.push(w,i),e.exportMenuWidth=i.offsetWidth,e.exportMenuHeight=i.offsetHeight;
a={
display:"block"}
;
d+e.exportMenuWidth>m?a.right=m-d-f-u+"px":a.left=d-u+"px";
c+h+e.exportMenuHeight>n&&g.alignOptions.verticalAlign!=="top"?a.bottom=n-c-u+"px":a.top=c+h-u+"px";
v(i,a);
e.openMenu=!0}
,addButton:function(b){
var a=this,d=a.renderer,c=k(a.options.navigation.buttonOptions,b),j=c.onclick,h=c.menuItems,g,e,l={
stroke:c.symbolStroke,fill:c.symbolFill}
,q=c.symbolSize||12;
if(!a.btnCount)a.btnCount=0;
if(!a.exportDivElements)a.exportDivElements=[],a.exportSVGElements=[];
if(c.enabled!==!1){
var m=c.theme,n=m.states,o=n&&n.hover,n=n&&n.select,i;
delete m.states;
j?i=function(){
j.apply(a,arguments)}
:h&&(i=function(){
a.contextMenu(e.menuClassName,h,e.translateX,e.translateY,e.width,e.height,e);
e.setState(2)}
);
c.text&&c.symbol?m.paddingLeft=f.pick(m.paddingLeft,25):c.text||p(m,{
width:c.width,height:c.height,padding:0}
);
e=d.button(c.text,0,0,i,m,o,n).attr({
title:a.options.lang[c._titleKey],"stroke-linecap":"round"}
);
e.menuClassName=b.menuClassName||"highcharts-menu-"+a.btnCount++;
c.symbol&&(g=d.symbol(c.symbol,c.symbolX-q/2,c.symbolY-q/2,q,q).attr(p(l,{
"stroke-width":c.symbolStrokeWidth||1,zIndex:1}
)).add(e));
e.add().align(p(c,{
width:e.width,x:f.pick(c.x,y)}
),!0,"spacingBox");
y+=(e.width+c.buttonSpacing)*(c.align==="right"?-1:1);
a.exportSVGElements.push(e,g)}
}
,destroyExport:function(b){
var b=b.target,a,d;
for(a=0;
a<b.exportSVGElements.length;
a++)if(d=b.exportSVGElements[a])d.onclick=d.ontouchstart=null,b.exportSVGElements[a]=d.destroy();
for(a=0;
a<b.exportDivElements.length;
a++)d=b.exportDivElements[a],B(d,"mouseleave"),b.exportDivElements[a]=d.onmouseout=d.onmouseover=d.ontouchstart=d.onclick=null,o(d)}
}
);
F.menu=function(b,a,d,c){
return["M",b,a+2.5,"L",b+d,a+2.5,"M",b,a+c/2+0.5,"L",b+d,a+c/2+0.5,"M",b,a+c-1.5,"L",b+d,a+c-1.5]}
;
A.prototype.callbacks.push(function(b){
var a,d=b.options.exporting,c=d.buttons;
y=0;
if(d.enabled!==!1){
for(a in c)b.addButton(c[a]);
t(b,"destroy",b.destroyExport)}
}
)}
)(Highcharts);