在数据可视化领域,折线图是一个非常常见的图形类型,它能够非常清晰地展示数据的趋势和变化。
以下是使用Graphics类绘制折线的代码示例:
        private void Draw()
        {
            Bitmap bitM = new Bitmap(this.zpic.Width, this.zpic.Height);
            Graphics g = Graphics.FromImage(bitM);
            g.Clear(Color.White);
            Point[] points = new Point[4];
            Random r = new Random();
            for (int i = 0; i < 4; i++)
            {
                points[i].X = r.Next(20, this.zpic.Width);
                points[i].Y = r.Next(30, this.zpic.Height);
            }
            g.DrawLines(new Pen(Color.FromArgb(r.Next(1, 255), r.Next(1, 255), r.Next(1, 255))), points);  //绘制折线
            this.zpic.BackgroundImage = bitM;
        }
在上面的代码中,首先初始化了Graphics类和画笔Pen对象。
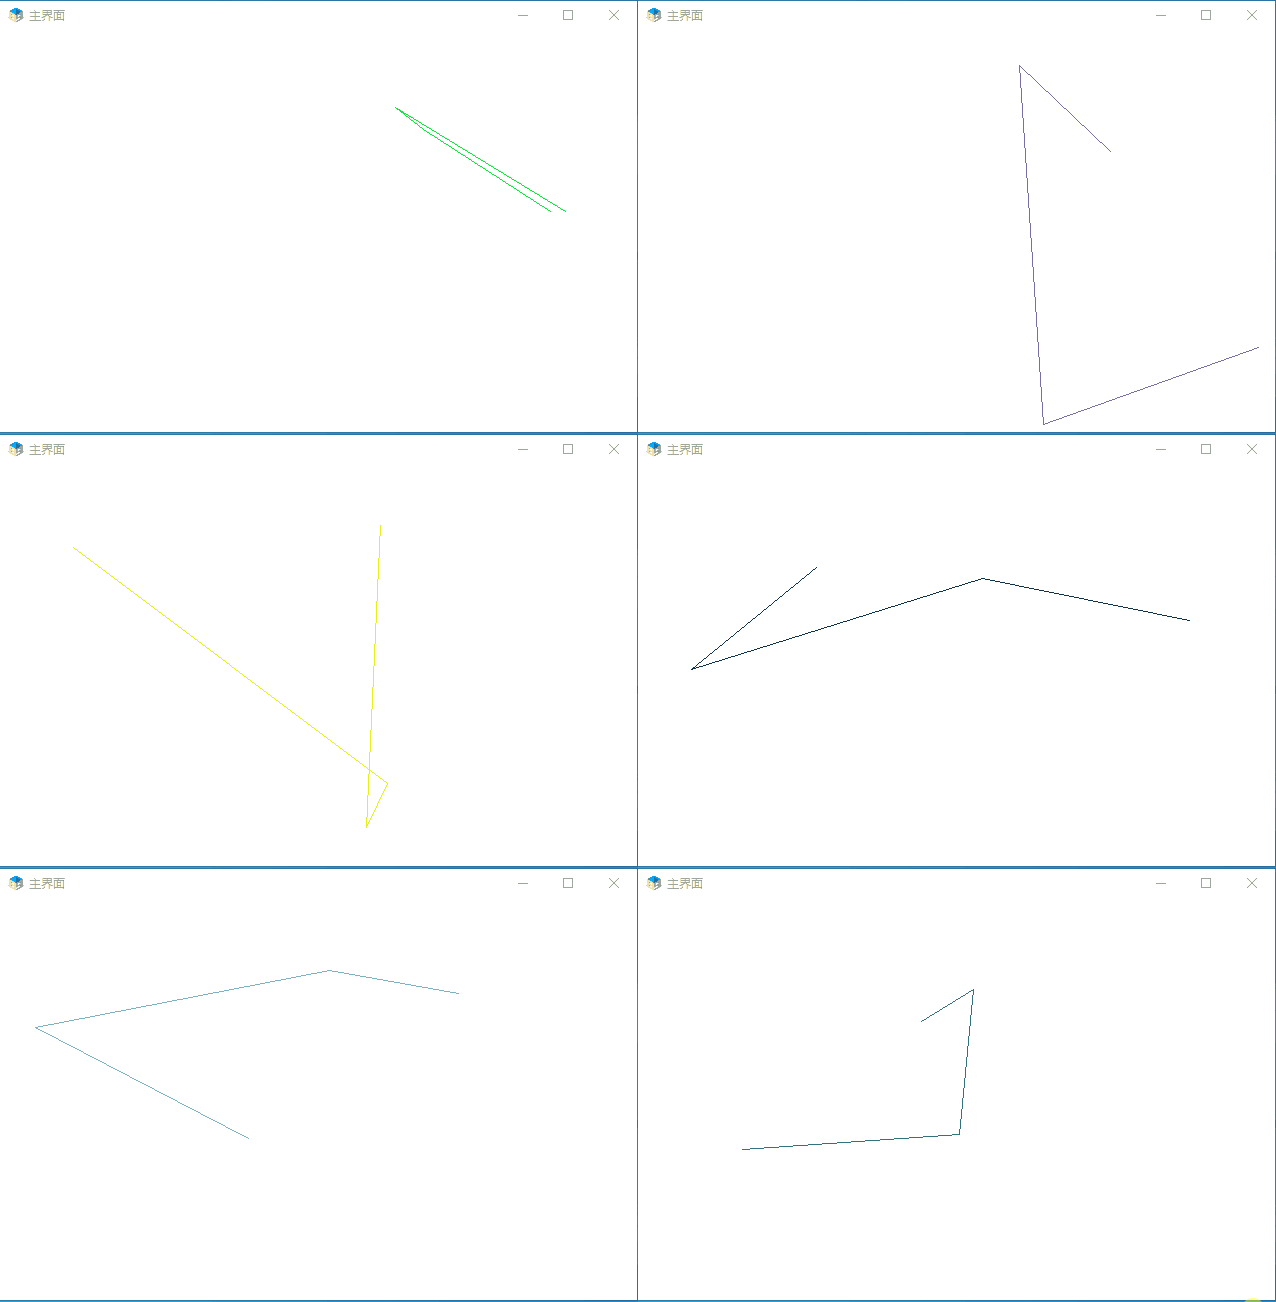
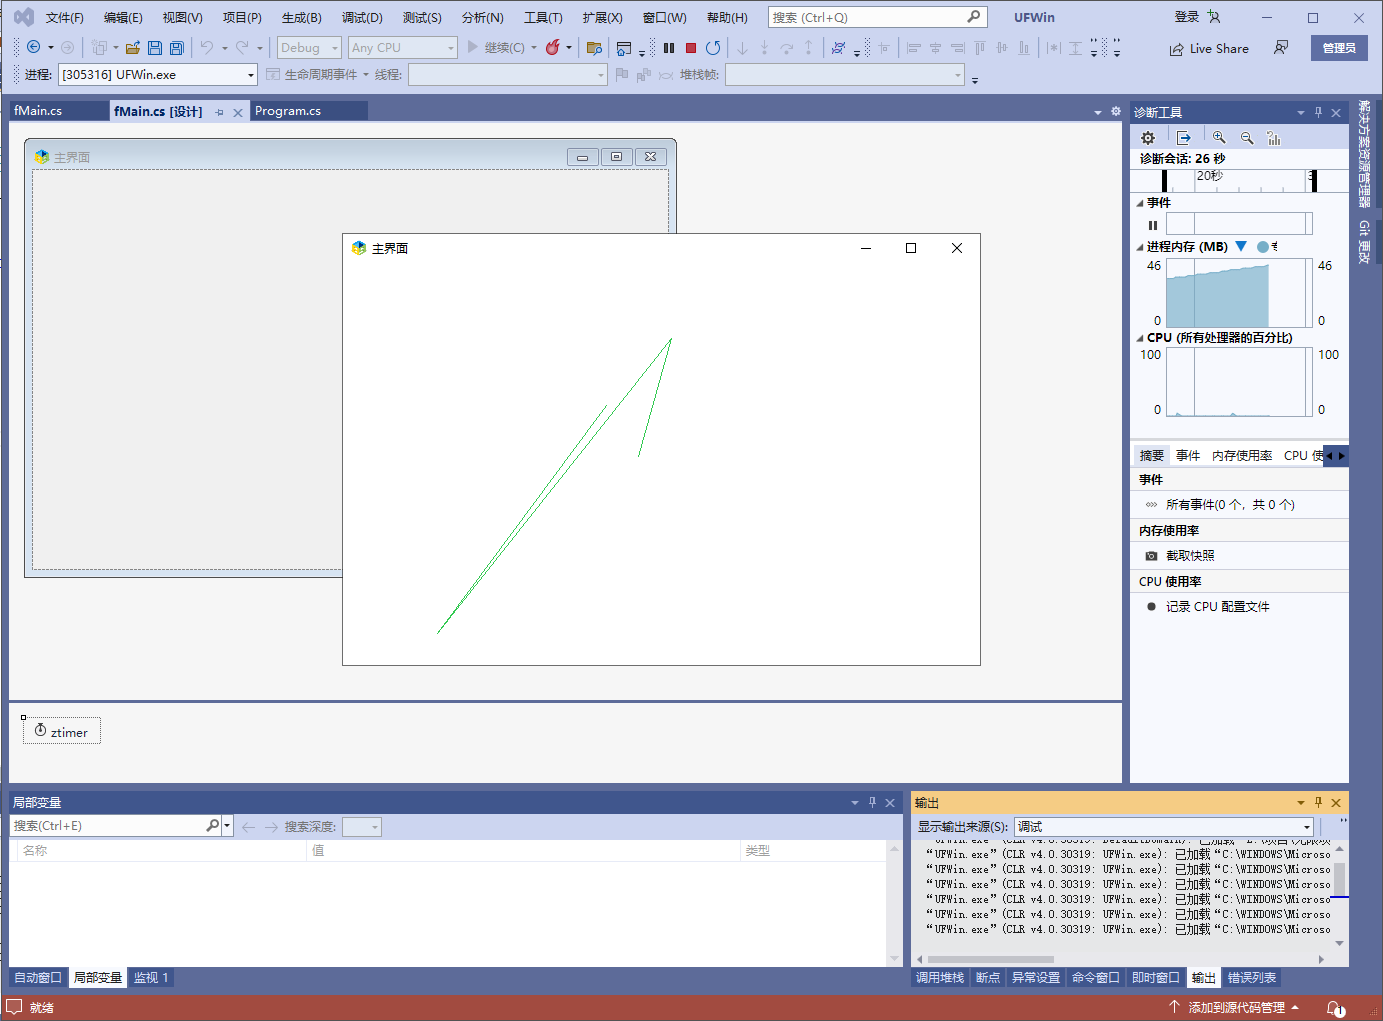
效果如下:


