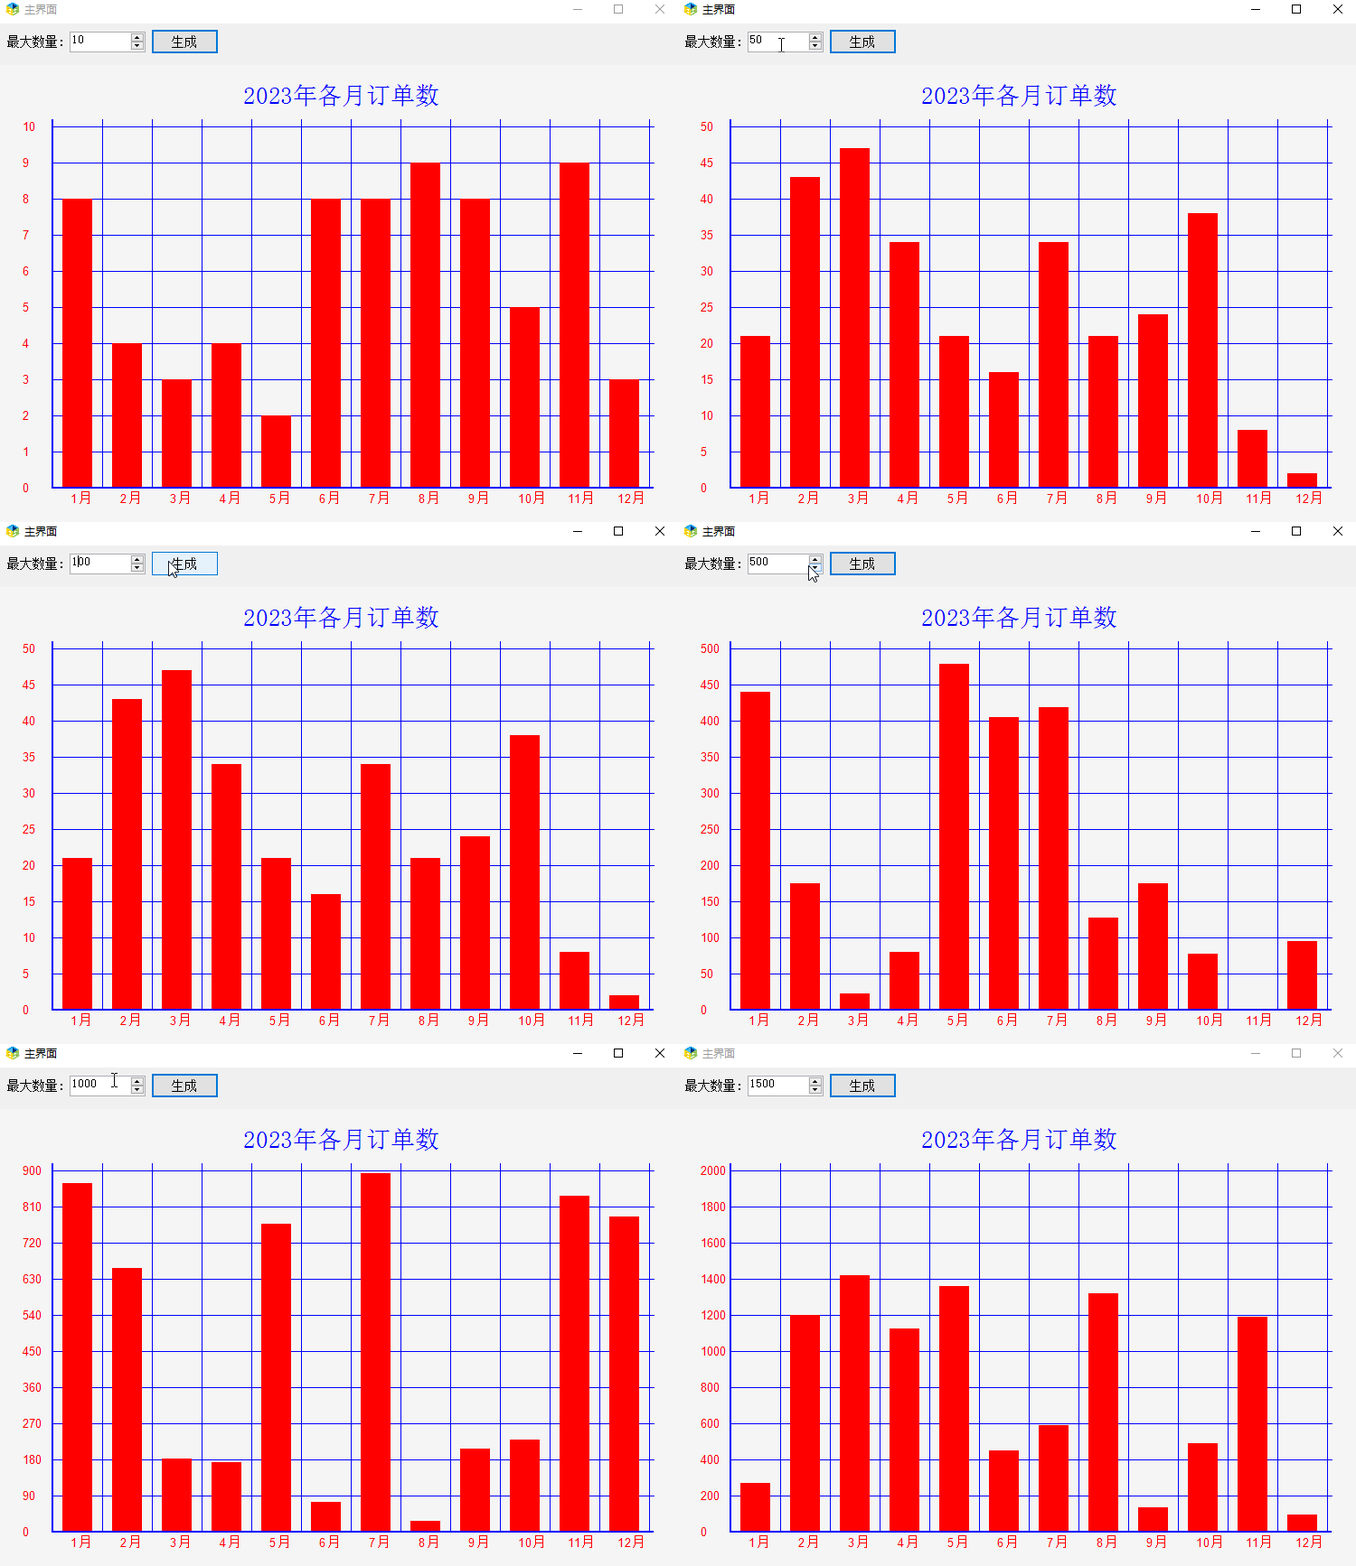
在实际业务中,经常需要对某一时间段的业务数据进行分析和比较。如果数据数量较大,很难直观地看到数据的变化趋势和规律。因此,生成柱状图报表是一种常用的数据可视化方式。
下面来写一个纯代码,不引用任何第三方dll的报表,只需要凑相应的数据即可直接生成报表,代码很简洁.
对于程序员来说,将数据库查询结果生成实体非常简单,首先建一个实体:
        public class StatYear
        {
            /// <summary>
            /// 月份
            /// </summary>
            public string month { get; set; }
            /// <summary>
            /// 数量
            /// </summary>
            public int count { get; set; }
        }
用上面的类,构建基础数据信息.然后根据数据来画实体信息
        public void DrawLine(List<StatYear> list, string title)
        {
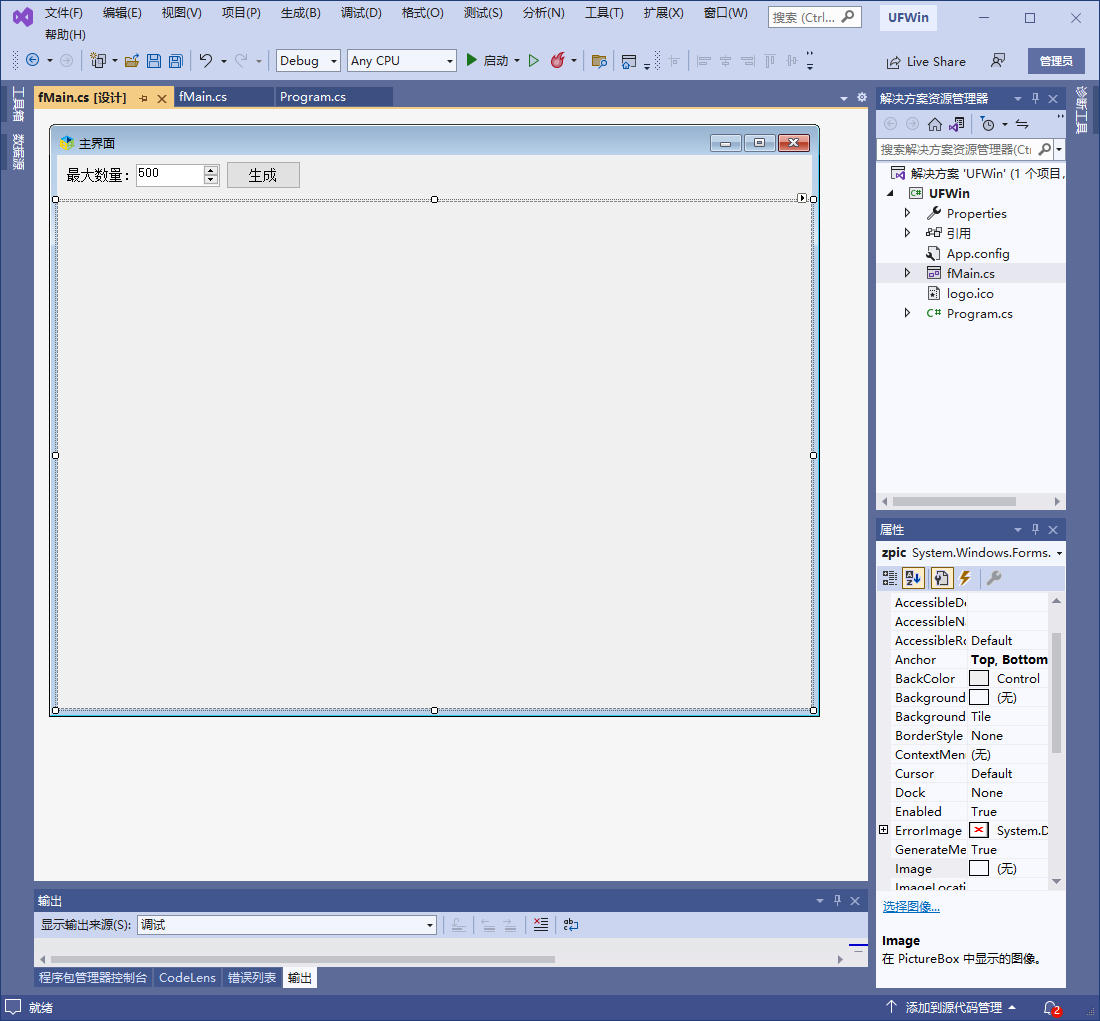
            int height = this.zpic.Height, width = this.zpic.Width;
            System.Drawing.Bitmap image = new System.Drawing.Bitmap(width, height);
            //创建Graphics类对象
            Graphics g = Graphics.FromImage(image);
            //清空图片背景色
            g.Clear(Color.White);

            Font font = new System.Drawing.Font("Arial", 10, FontStyle.Regular);
            Font font1 = new System.Drawing.Font("宋体", 20, FontStyle.Regular);
            System.Drawing.Drawing2D.LinearGradientBrush brush = new System.Drawing.Drawing2D.LinearGradientBrush(new Rectangle(0, 0, image.Width, image.Height), Color.Blue, Color.Blue, 1.2f, true);
            g.FillRectangle(Brushes.WhiteSmoke, 0, 0, width, height);
            Brush brush1 = new SolidBrush(Color.Blue);

            g.DrawString(title, font1, brush1, new PointF((width - title.ToString().Length * 22)/2, 20));

            //计算数量最大值
            int countmax = list.Max(x => x.count);
            if (countmax.ToString().Length <= 2) { countmax = countmax + (10 - int.Parse(countmax.ToString().Substring(countmax.ToString().Length - 1, 1))); }
            else { countmax = countmax + (int.Parse("1".PadRight(countmax.ToString().Length, '0')) - int.Parse(countmax.ToString().Substring(1, countmax.ToString().Length - 1))); }

            Pen mypen = new Pen(brush, 1);

            //坐标距离上下左右距离
            int stop = 60, sleft = 60, sbottom = 40, sright = 30;
            //画2条主坐标X和Y线条
            Pen penxy = new Pen(Color.Blue, 2);
            //绘制Y柱主线
            g.DrawLine(penxy, sleft, stop, sleft, height - sbottom);
            //绘制X柱主线
            g.DrawLine(penxy, sleft - 1, height - sbottom, width - sright, height - sbottom);

            //Y柱拆分成10条线路,间距为
            int yspace = (height - sbottom - stop) / 10;
            for (int i = 1; i <= 10; i++)
            {
                //从底部向上画Y线条
                g.DrawLine(mypen, sleft, height - sbottom - yspace * i, width - sright, height - sbottom - yspace * i);
            }
            //Y柱文字写入
            int value = countmax / 10;
            for (int i = 0; i <= 10; i++)
            {
                //从底部向上写文字
                g.DrawString((value * i).ToString(), font, Brushes.Red, 25, height - sbottom - yspace * i - 8); //设置文字内容及输出位置
            }

            //写X坐标线
            int xspace = (width - sleft - sright) / list.Count;
            for (int i = 1; i <= list.Count + 1; i++)
            {
                g.DrawLine(mypen, sleft + xspace * i, stop, sleft + xspace * i, height - sbottom);
            }
            this.zpic.BackgroundImage = image;
        }
下面调用调试即可:
        public void Draw()
        {
            //年某商品走势
            List<StatYear> list = new List<StatYear>();
            for (int i = 1; i <= 12; i++)
            {
                list.Add(new StatYear() { month = i.ToString() + "月", count = Random(1, (int)zmax.Value) });
            }
            DrawLine(list, DateTime.Now.ToString("yyyy") + "年各月订单数");
        }
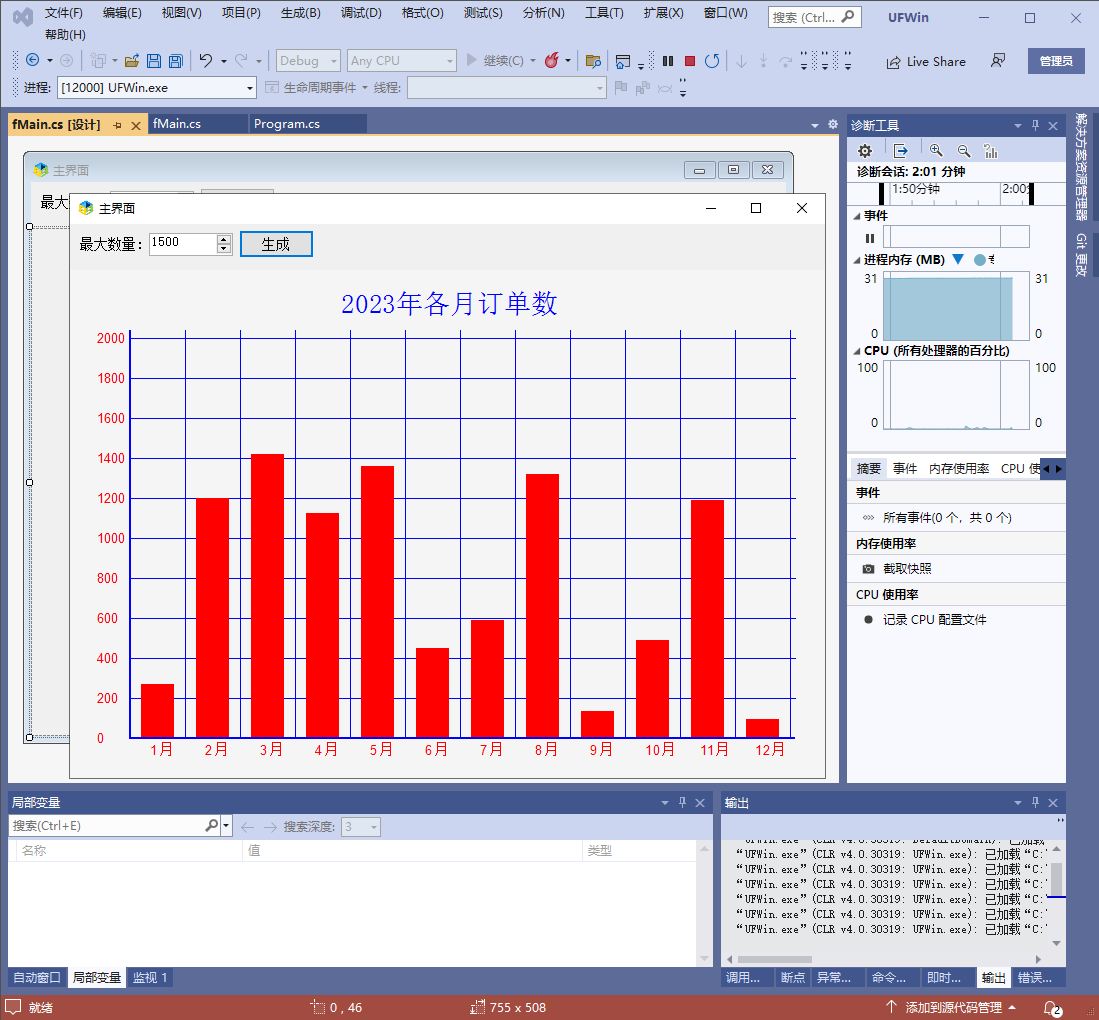
效果图如下:


